Determining the habitat suitability of invasive plant species
Our work to determine habitat suitability for invasive plant species in Germany is based on two fundamental procedures that we have explained in detail in two scientific publications - firstly, the remote sensing classification of habitat types based on satellite data, on the other hand the species distribution modelling, in which the occurrence of invasive plant species is related to the environmental conditions of the habitats they colonise. A brief description of the methods used can be found here - the two publications are linked at the end of the page.
Methodology
In the first step, we classified Germany into different habitat types using MODIS satellite data with a resolution of 500 metres. Here, we developed a model that classifies natural and semi-natural areas into 18 different classes based on their similarity to Natura 2000 flora-fauna-habitat types. To perform this classification, we used machine learning methods, more specifically Support Vector Machines (SVM), Random Forests (RF) and C5.0. These models were trained on homogeneous Natura 2000 areas that are mainly covered by a single habitat type. The classification was then checked with validation data from 2010 and 2019.

Methodological scheme of the classification.
Three machine learning algorithms (SVM, RF, C5.0) are trained and tested individually in training years 2013, 2014 and 2016 and then validated with independent test sets. Each model combination (training year and method) is applied to the 2010 and 2019 study area, respectively, resulting in 9 predictive models for each test year, from which a final class assignment emerges by majority vote (Sittaro et al. 2022)
Based on the classification of habitat types, we then created habitat suitability models for the 46 invasive plant species. We took into account 18 environmental variables, including soil type, altitude, land use, transport infrastructure, temperature and precipitation.
For the modelling, we also used machine learning, this time the SVM and Boosted Regression Trees (BRT) techniques. In these models, we integrated projected climate variables for two time horizons (2041-2060 and 2061-2080) and three emission scenarios to determine changes in habitat suitability under future climate conditions.
The relative probabilities of occurrence generated by the models were then classified into five 'habitat suitability classes' (unsuitable, poorly suitable, suitable, well suitable, very well suitable), allowing for more robust prediction and clearer representation in our maps.
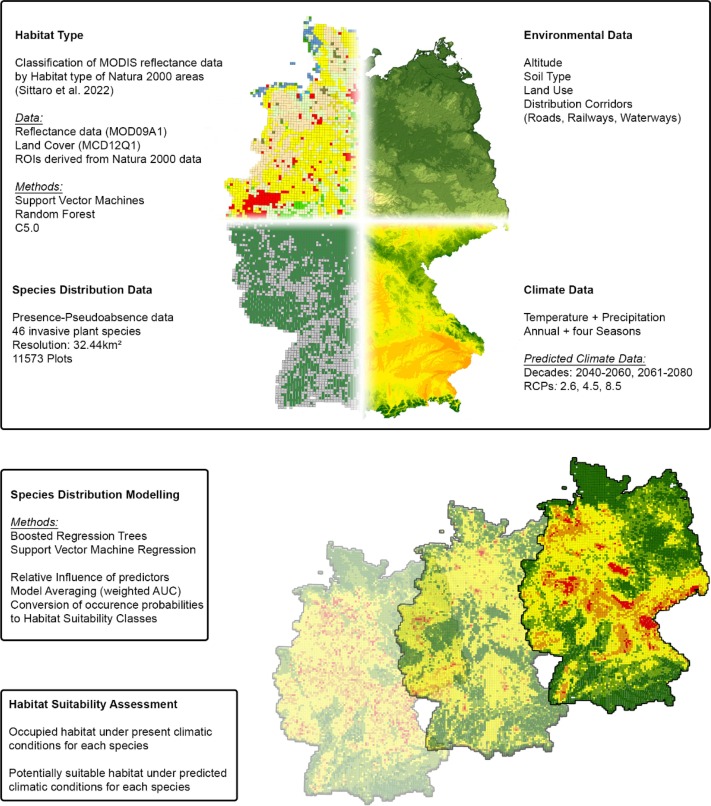
Overview of the data and methods used in the modelling.
In addition to the habitat type, which comes from the remote sensing classification, distribution data, environmental and climatic variables form the basis of the habitat models (Sittaro et al. 2023).
The occurrence data used for our models are based on floristic mapping provided by volunteer experts, universities and nature conservation authorities (FLORAWEB). The plant locations are assigned to quadrants whose cells have a size of 5 x 3 arc minutes. This corresponds to an average plot size of 32.44 km² and a total number of 11,573 plots in the study area. The temporal resolution of the database consists of three time classes: Pre-1950, 1950-1979 and Post-1980.
Depending on the region and spatial resolution, a variety of environmental factors can be used to explain the distribution patterns of plant species. We therefore used a wide range of environmental variables, including altitude, soil type, temperature and precipitation, land use and potential dispersal corridors in the form of roads, railway tracks and rivers and canals. The impact of existing plant communities (habitat type) on the spread of invasive species was also considered. In terms of land use, habitat type and soil type, the predominant categories within the quadrant were assigned to the cells. For the dispersal corridors, the respective sums of the lengths of roads, railway tracks and waterways were assigned to the cells. The climate data are taken from the CHELSA-database, which provides temperature and precipitation patterns for different time periods at a resolution of 30 arc seconds.
Machine learning methods are suitable for modelling the spread of invasive plant species and assessing the relative influences of underlying environmental factors. Climate factors have the greatest influence on the spread of invasive plant species in Germany, and many invasive species have not yet fully occupied their available habitat under current climate conditions.
However, our results also show that even when a number of environmental factors are taken into account, there are some limitations with regard to the transferability of the models to predicted climate scenarios. Caution is required when interpreting the results, for example, for species whose distribution is particularly dependent on anthropogenic factors, and with regard to the often complex interactions between climate and land use.
Our modelling approaches provide insights into the potential suitability of habitats for invasive plant species under current and future climate conditions and can help to improve monitoring and control measures on a broad scale.

Hotspots of invasive plant species in Germany
The number of species finding potentially suitable habitat is presented for each quadrant for current and projected climate conditions. Projections for future climate scenarios are based on the Representative Concentration Pathway 4.5 (Sittaro et al. 2023).
Publications
Which factors determine the invasion of plant species? Machine learning based habitat modelling integrating environmental factors and climate scenarios.
Sittaro F., Hutengs C., Vohland, M.:
International Journal of Applied Earth Observation and Geoinformation, 2023; 116. https://doi.org/10.1016/j.jag.2022.103158.